Declaration of Health and Productivity Management
We recognize that the mental and physical healthy lives of our employees and their families bring happiness to both the company and local communities, and will work on measures to promote good health as an entire group.

Hisataka Ikuta
President, CEO & COO

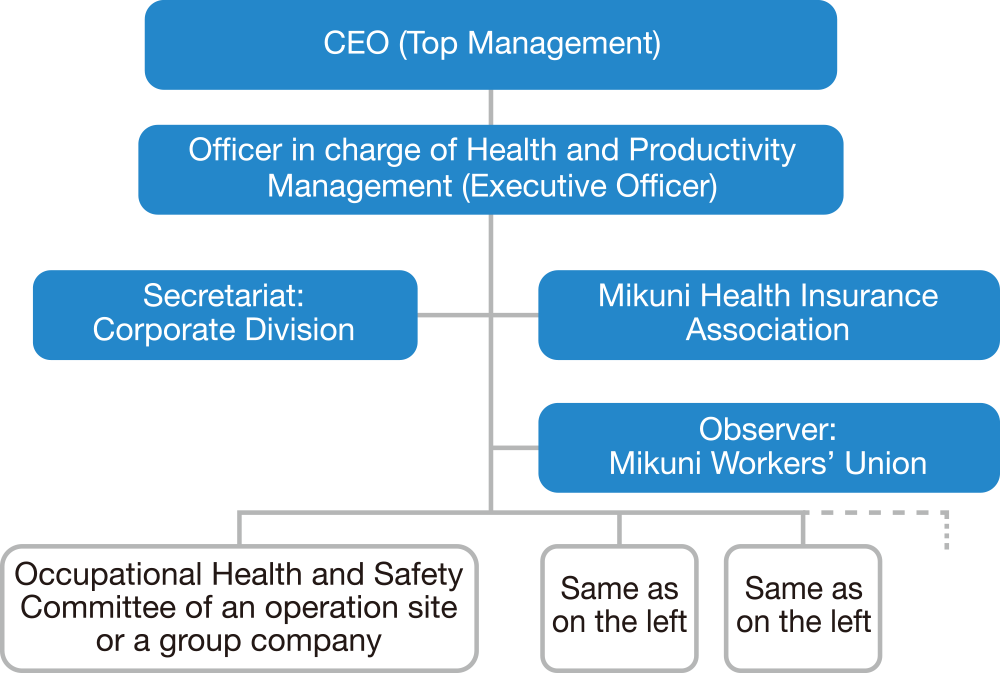
Promotion Oganization
An executive officer is assigned as the top person in charge of health and productivity management to ensure the thorough implementation of policies and measures. To further expand activities, we set goals for each measure based on our strategy map.
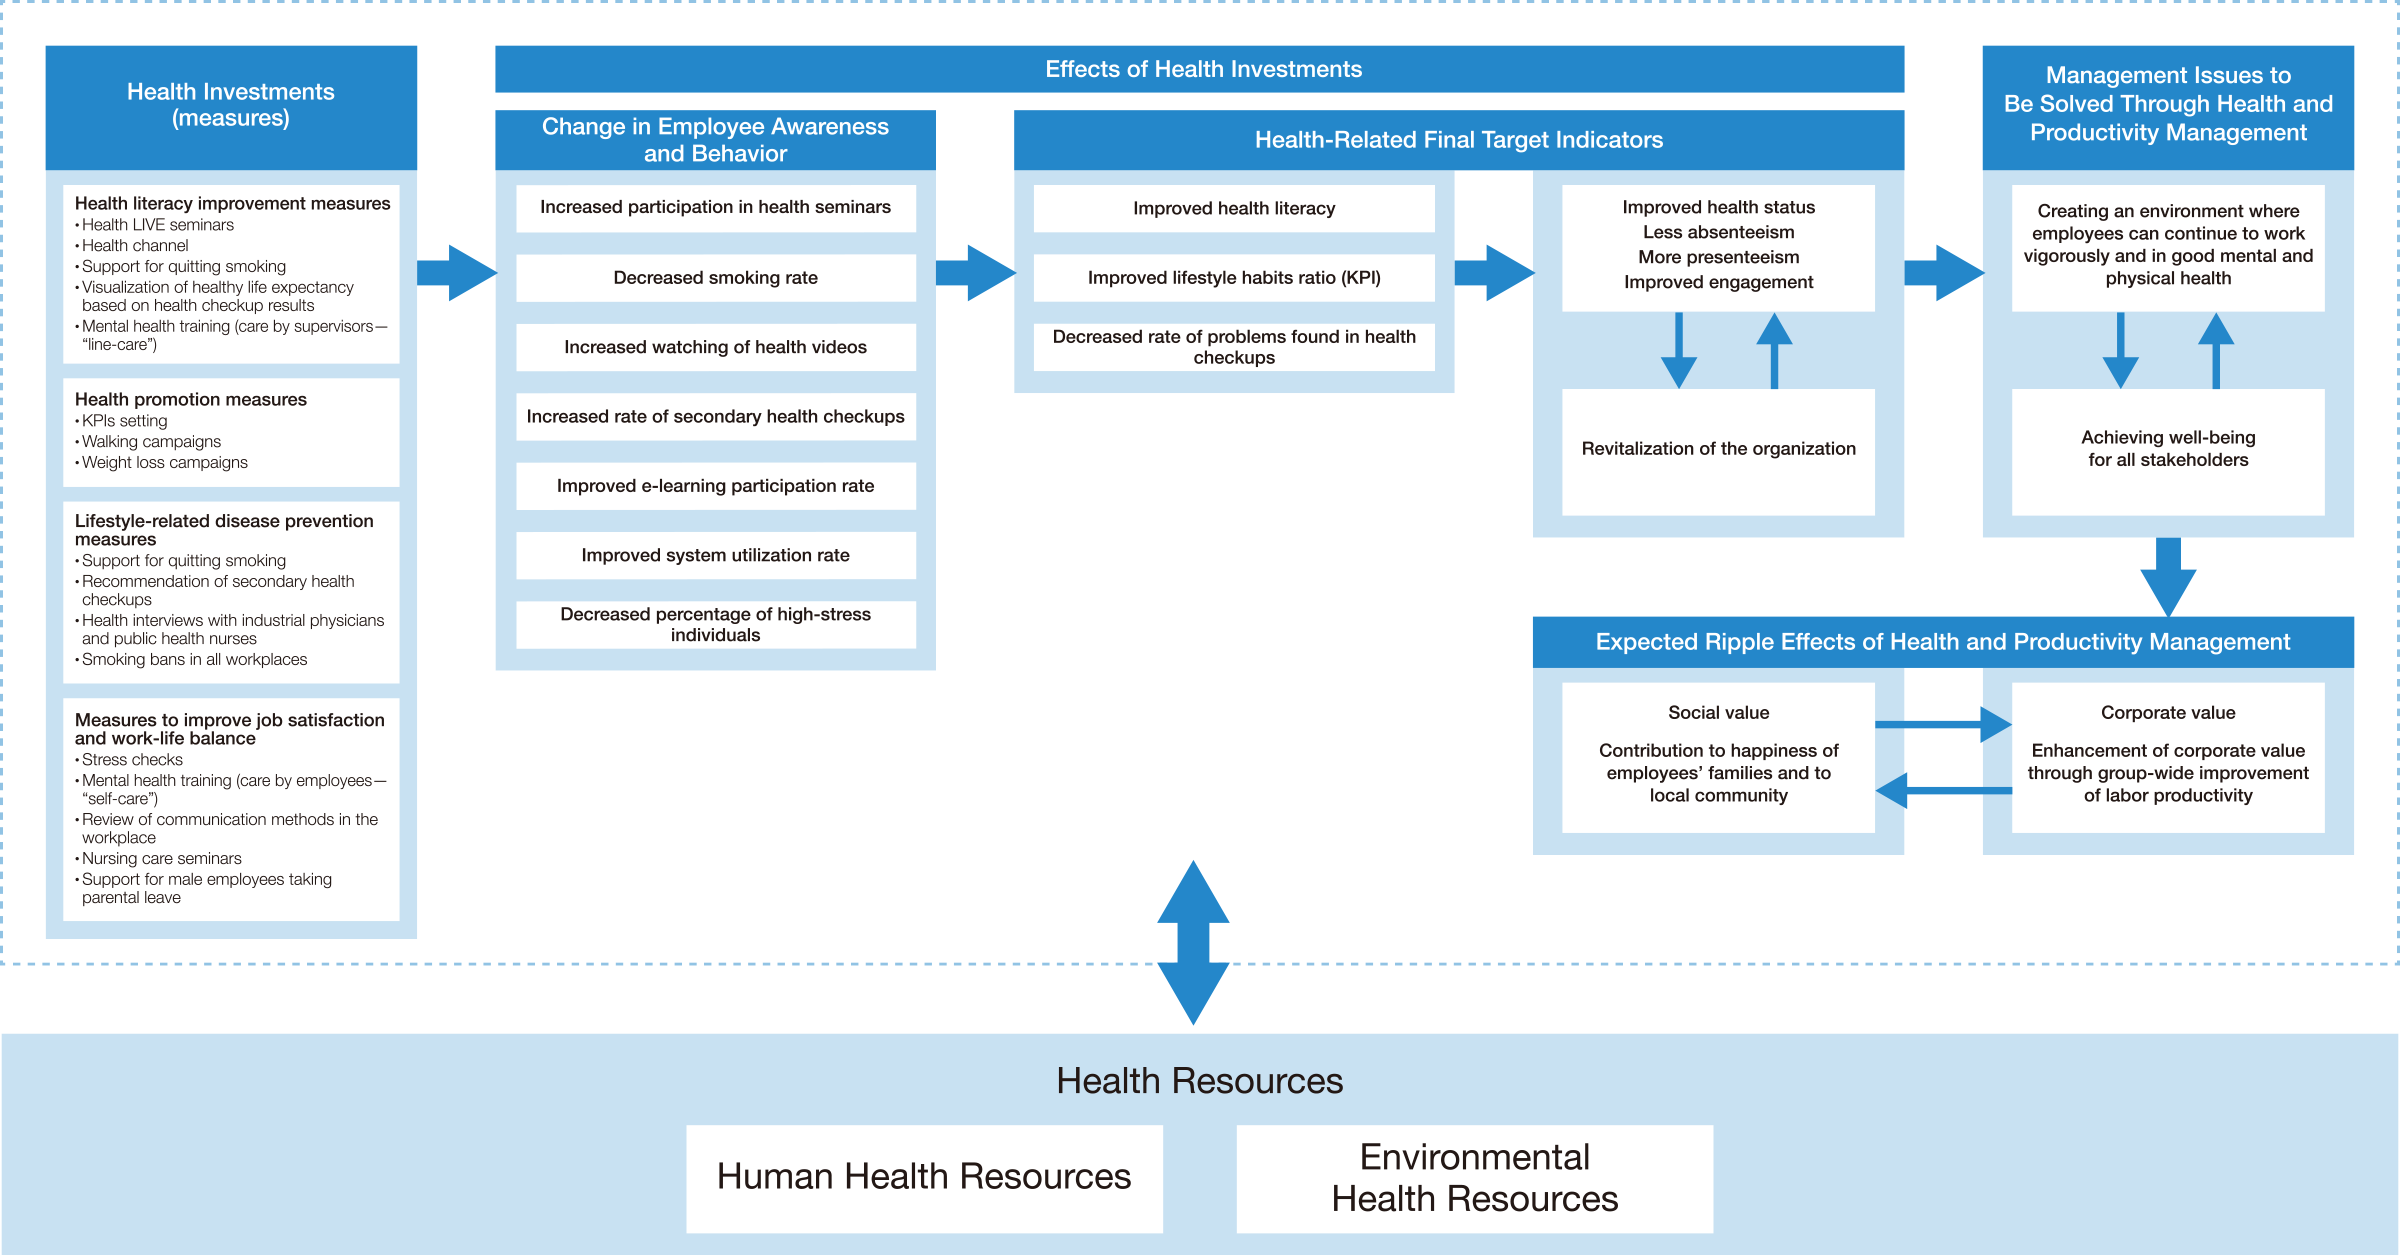
Strategy Map
The following diagram shows what kind of effect each measure will have on promoting health and productivity management at Mikuni.
Health Initiatives and Achievements
This section shows the status of health initiatives and KPIs (target values).
The achievements of various initiatives outlined in the strategy map are quantitatively and consistently monitored through surveys, seminar participation rates, and other metrics. In doing so, we are promoting collaboration with the health insurance society through a PDCA (Plan-Do-Check-Act) cycle, while aligning with our focus on improving employees' health literacy and reducing high-risk individuals.
| Health Initiatives | Key Performance Indicator (KPI) | 2021 Results | 2022 Results | 2023 Results | |
|---|---|---|---|---|---|
| Improvement of Health Literacy | Participation in measures for all employees (Number of views of Health LIVE Seminars) |
1,000 people | - | 430 people | 565 people |
| Number of views of Health Channel (Diet, Sleep, Mental Health, Lifestyle, etc.) | 1,500 views or more | - | 2,600 views | 1,300 views | |
| Implementation of Hygiene Talks (Cumulative number of hygiene talks conducted at each business site) | 40 times or more | 21 times | 31 times | 34 times | |
| Participation in measures related to women’s health issues (Participation rate in training on women’s health issues for all employees) |
90% or more | 20% | - | 59.20% | |
| Participation in measures related to women’s health issues (Participation rate in training for managers on women’s health issues) |
90% or more | - | - | 61.90% | |
| Mental Health Line Care Training Participation Rate | 100% | 96% | 100% | 95.50% | |
| Mental Health Self-Care Training Participation Rate | 100% | 98% | 97.70% | 98.10% | |
| Absenteeism*1 Average number of days off due to physical or mental health issues in the past year |
5 days or less | 2.8 days | 8 days | 5.5 days | |
| Presenteeism*1 Average score based on the University of Tokyo’s 1-item version |
85% or more | 81.80% | 80.30% | 82.20% | |
| Health Literacy Status*1 Percentage of employees whose health awareness has increased or remained high due to company health measures in the past year |
70% or more | - | - | 58.40% | |
| Amount invested in individual health measures (excluding regular health checkups) | - | 27,331 thousand yen | 30,365 thousand yen | 30,788 thousand yen | |
| Employee Satisfaction with Each Initiative *1 Survey: To what extent do you feel that the company is making sufficient efforts to maintain and promote employees' health and improve the working environment? The percentage of responses indicating "Strongly agree" or "Agree." *2 |
70% or more | 37.20% | 50.80% | 52.80% | |
| Health Promotion | Implementation of Walking Campaign (Number of participants and average steps in the Mikuni Health Insurance Society) | 300 people, 920,000 steps |
111 people, 772,125 steps |
211 people, 809,213 steps |
230 people, 812,490 steps |
| Implementation of Weight Loss Campaign (Number of participants and average weight loss rate in the Mikuni Health Insurance Society) | 300 people -3.0% |
66 people -1.9% |
82 people -1.5% |
82 people -1.1% |
|
| Prevention of Lifestyle-Related Diseases for all ages | Regular health checkup participation rate | 100% | 100% | 100% | 100% |
| Percentage of findings in regular health checkups. ( ) for those aged 35 and over | 30% or less | 28.9% (34.6%) |
27% (33%) |
30.2% (36.3%) |
|
| Re-examination rate for those requiring re-examination in regular health checkups | 100% | 61.30% | 67.70% | 82% | |
| Smoking rate | 30% or less | 32.40% | 31.40% | 30.50% | |
| Participation rate in measures for high-risk individuals (Participation rate in specific health guidance for those with abnormal blood pressure) | 50% or more | - | 42% | 49.20% | |
| Participation rate in measures for high-risk individuals (Participation rate in specific health guidance for those with abnormal blood glucose) | 50% or more | - | 41.10% | 43.50% | |
| Management rate of high-risk individuals (Rate of individuals with abnormal blood pressure) | 30% or less | - | 40% | 38.80% | |
| Management rate of high-risk individuals (Rate of individuals under treatment for blood pressure) | 50% or more | - | 33.70% | 36.90% | |
| Management rate of high-risk individuals (Rate of individuals with abnormal blood glucose) | 30% or less | - | 34% | 42.10% | |
| Management rate of high-risk individuals (Rate of individuals under treatment for blood glucose) | 20% or more | - | 9.10% | 7.70% | |
| Sleep Time*1 Percentage of employees with 6 hours or more of sleep |
70% or more | 46.30% | 45.40% | 45.80% | |
| Improvement of Work-Life Balance and Job Satisfaction | Stress check participation rate | 100% | 98% | 97.70% | 95.90% |
| High-stress rate | 15% or less | 19.80% | 20.80% | 21.60% | |
| Average length of service | - | 18.7 years | 19.1 years | 19.5 years | |
| Number of employees on leave for more than one month due to personal illness (excluding work-related injuries) | - | 11 people | 12 people | 17 people | |
| Average monthly overtime hours | 15 hours or less | 21.5 hours | 21.8 hours | 19.5 hours | |
| Implementation of Engagement Survey*1 | Engagement score for FY2024 40 points or more |
37.1 points | 36.4 points | 35.8 points | |
- Notes
- * 1: Using a unique survey method, periodic observations were conducted for all employees.
The number of people measured and the response rates by fiscal year are as follows:
Fiscal Year Number of People Measured Response Rate
2021 1,776 94.2%
2022 1,794 98.7%
2023 1,774 99.8% - * 2:In the 2021 fiscal year, the option "Don't know" was available, but it was eliminated from the 2022 fiscal year onward.
- * 3:Based on the regular health checkup results, various initiatives are being implemented in collaboration with the health insurance society as key measures.