
Financial Highlights
■ First Quarter (Q1)
■ Second Quarter (2Q)
■ Third Quarter (3Q)
■ Fiscal Year (FY)
Sales
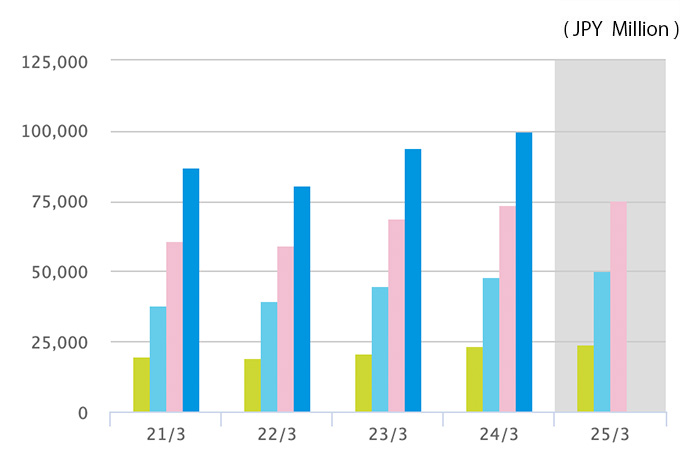
| 22/3 | 23/3 | 24/3 | 25/3 | 26/3 | |
|---|---|---|---|---|---|
| FY | 80,789 | 93,847 | 99,941 | 101,428 | 103,419 |
| 3Q | 59,529 | 68,972 | 73,729 | 75,504 | 75,521 |
| 2Q | 39,556 | 44,810 | 47,942 | 50,283 | 49,375 |
| 1Q | 19,183 | 20,637 | 23,279 | 24,249 | 24,589 |
Operating profit
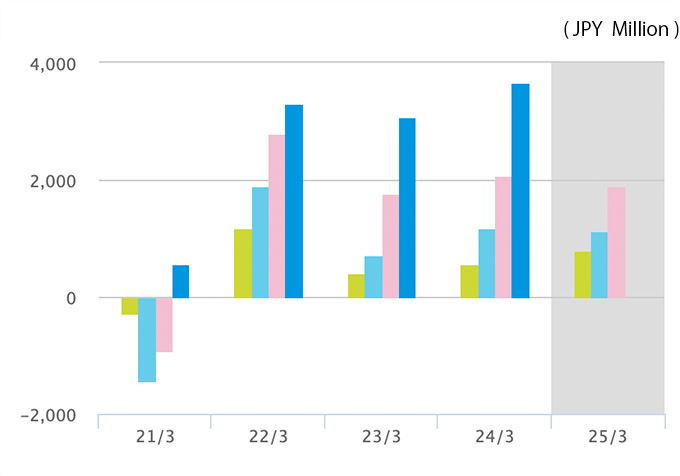
| 22/3 | 23/3 | 24/3 | 25/3 | 26/3 | |
|---|---|---|---|---|---|
| FY | 3,318 | 3,089 | 3,672 | 3,031 | 4,181 |
| 3Q | 2,804 | 1,781 | 2,077 | 1,888 | 2,986 |
| 2Q | 1,902 | 724 | 1,187 | 1,140 | 1,857 |
| 1Q | 1,183 | 415 | 560 | 804 | 1,318 |
Ordinary Income
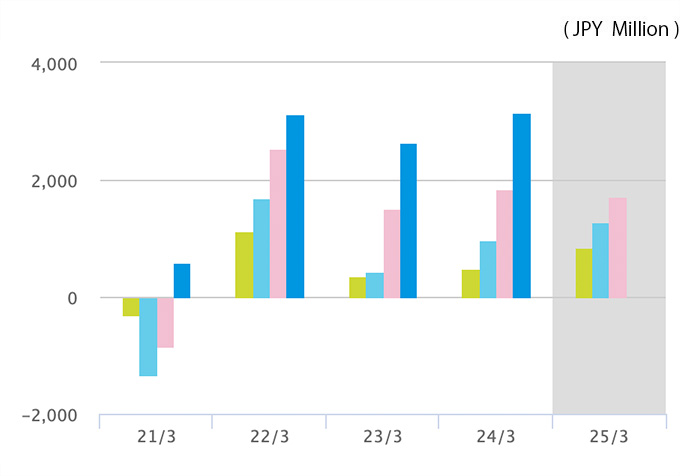
| 22/3 | 23/3 | 24/3 | 25/3 | 26/3 | |
|---|---|---|---|---|---|
| FY | 3,137 | 2,644 | 3,161 | 2,845 | 3,340 |
| 3Q | 2,534 | 1,518 | 1,833 | 1,701 | 2,696 |
| 2Q | 1,685 | 429 | 973 | 1,288 | 1,646 |
| 1Q | 1,116 | 349 | 473 | 848 | 1,332 |
Net income attributable to shareholders of the parent company
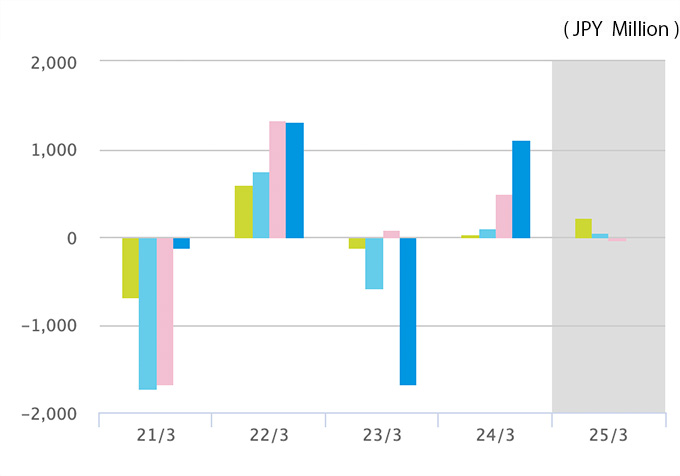
| 22/3 | 23/3 | 24/3 | 25/3 | 26/3 | |
|---|---|---|---|---|---|
| FY | 1,318 | -1,682 | 1,115 | 1,995 | 1,197 |
| 3Q | 1,341 | 84 | 460 | -69 | 1,320 |
| 2Q | 748 | -587 | 105 | 43 | 879 |
| 1Q | 591 | -122 | 26 | 205 | 757 |
Return on Equity
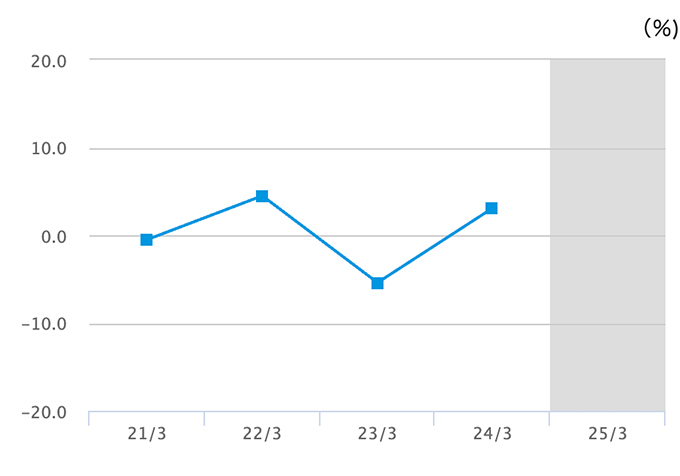
| 22/3 | 23/3 | 24/3 | 25/3 | 26/3 | |
|---|---|---|---|---|---|
| FY | 4.5 | -5.4 | 3.1 | 5.1 | 3.1 |
| 3Q | - | - | - | - | - |
| 2Q | - | - | - | - | - |
| 1Q | - | - | - | - | - |
Note: The above indices are updated on a yearly basis.
Total Assets
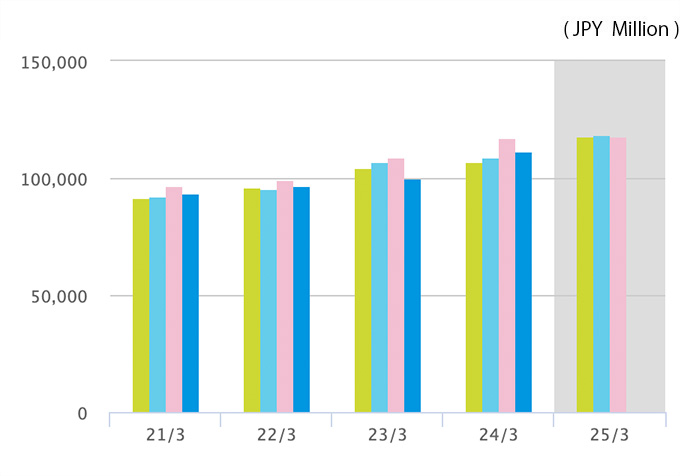
| 22/3 | 23/3 | 24/3 | 25/3 | 26/3 | |
|---|---|---|---|---|---|
| FY | 96,917 | 100,108 | 111,283 | 109,652 | 105,017 |
| 3Q | 99,186 | 108,800 | 117,311 | 117,854 | 113,789 |
| 2Q | 95,726 | 107,051 | 108,984 | 118,283 | 108,850 |
| 1Q | 96,225 | 104,622 | 106,735 | 117,852 | 113,683 |
Net Assets
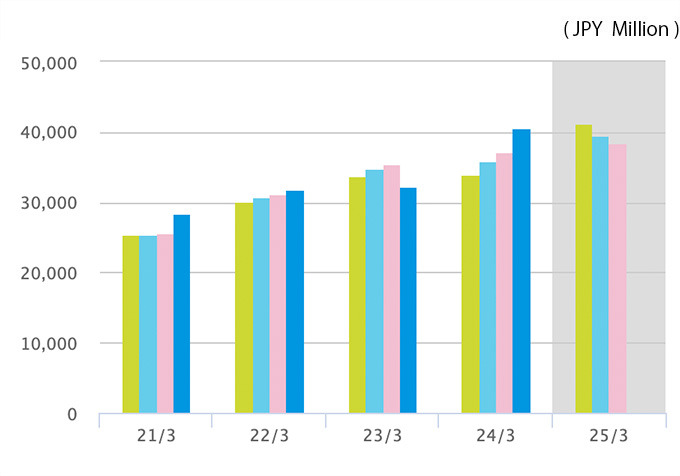
| 22/3 | 23/3 | 24/3 | 25/3 | 26/3 | |
|---|---|---|---|---|---|
| FY | 31,918 | 32,199 | 40,210 | 38,384 | 40,783 |
| 3Q | 31,091 | 35,458 | 37,253 | 37,982 | 40,042 |
| 2Q | 30,731 | 34,908 | 35,917 | 39,512 | 38,767 |
| 1Q | 30,154 | 33,798 | 33,885 | 40,830 | 37,169 |
Capital Adequacy Ratio
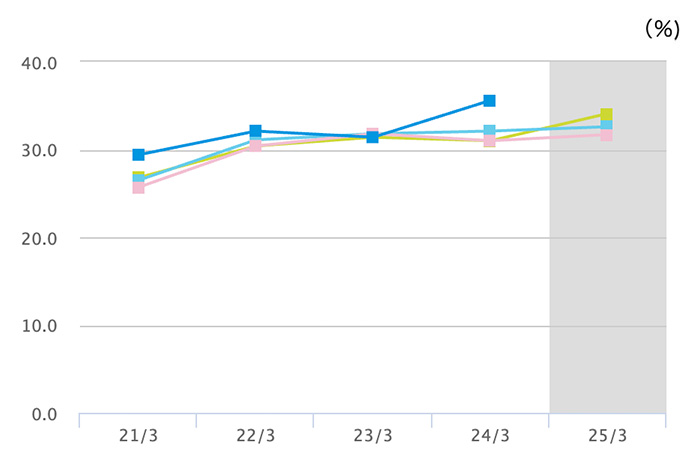
| 22/3 | 23/3 | 24/3 | 25/3 | 26/3 | |
|---|---|---|---|---|---|
| FY | 32.1 | 31.4 | 35.3 | 34.2 | 38.0 |
| 3Q | 30.4 | 31.8 | 31.0 | 31.4 | 34.4 |
| 2Q | 31.1 | 31.8 | 32.1 | 32.6 | 34.8 |
| 1Q | 30.4 | 31.4 | 31.0 | 33.9 | 31.9 |
*The second quarter (2Q) is the cumulative information from the first to the second quarter.
*The third quarter (3Q) is the cumulative information from the first to the third quarter.
Terms of Use
・In the event of an amendment to the Summary of Financial Results, etc., the contents of this data will not be reflected immediately.
・In the event of a stock split, etc., related indices are not retroactively adjusted.
・The frequency of updates may change due to changes in the format of the Summary of Financial Results and other factors.
The content of this data is based on the Summary of Financial Results.
However, there is a possibility of inaccuracies in the information due to human tampering by third parties, mechanical errors caused by malfunctioning equipment, and other factors beyond the control of the company.
Please refer to the Summary of Financial Results and other materials for detailed information on financial results.